Commercial EV charging utilization is quoted constantly and defined inconsistently, so the headlines need a careful reading. Utilization at destination sites, meaning multifamily, workplace, and hospitality properties in markets like California, the Pacific Northwest, and Colorado, is a different number, measured a different way, from the public fast-charging utilization figures that make industry headlines. This article keeps those two apart, because conflating them is how operators end up with the wrong expectation.
Two utilization numbers that get confused
The two utilization figures industry reporting quotes most often look like they should be comparable, and are not. They are measured against different denominators.
On the public side, the best-defined national figure comes from a named source. Paren's 2025 report put U.S. public DC fast-charging utilization at 16.2% in Q1 2025, rising to 16.4% by Q4, under Paren's stated tracked-time methodology. That is close to flat even as total sessions grew roughly 30% to an estimated 141 million in 2025, because new ports came online about as fast as demand grew (Paren, full-year 2025 report). The flat line has continued into 2026, in a narrow 15.6% to 16.4% band since early 2025: Paren put national utilization at 15.6% in Q1 2026, 15.8% in Q2, and 15.9% in Q3, with Q3 sessions of 50.4 million, up 26% from a year earlier. Regional spread under that average is wide. California averaged 23.4% in Q3 2026 and Los Angeles 31.8%, the highest of the top 30 metros and about twice the national rate. Paren's 2025 reporting put Los Angeles at 30.7% and San Diego at 26.0% in Q2 2025 (38.6% and 36.9% in the 12 p.m. to 7 p.m. peak window).
Destination utilization figures are usually quoted against a different denominator: the hours that matter for the use case, such as evenings and overnight at an apartment building or weekday business hours at a workplace. A charger that is busy every weekday business hour is highly utilized for its purpose even though it sits idle nights and weekends. Occupancy of a relevant window, hours-in-use across the whole year, and energy throughput are three different measures, and they are not interchangeable.
A percentage of time is the wrong unit for revenue, because revenue follows kilowatt-hours. A port that is in use 16% of the time earns very different amounts depending on how fast the vehicle actually draws power. For that reason the sensitivity benchmarks in our commercial ROI snapshot (the full version, available by request, is where the utility-specific ladders apply; see its access page) are stated for DC fast charging as kWh per port per day rather than a flat occupancy percent. The earlier fixed-percentage benchmarks overstated realistic throughput, and a percentage calibrated at one charger power is not reachable at another, because the vehicle, not the charger, sets the session power.
The tool's DC fast charging ladder has three rungs, and which ladder you see depends on the utility selected:
| Rung | National ladder | Southern California ladder |
|---|
| Conservative | 175 kWh/port-day, a secondary market | 250 kWh/port-day, the national average |
| Moderate | 250 kWh/port-day, the national average | 470 kWh/port-day, a Southern California metro |
| Strong | 430 kWh/port-day, a highest-utilization metro | 650 kWh/port-day, a Southern California flagship |
Paren measures utilization as the share of tracked time, during the hours a charger is open, spent on successful and unsuccessful charging activity. The tool's kWh figures translate back to that measure only roughly, and only under an assumption: the tool treats a session on a 350 kW-class port as averaging about 65 kW delivered. At 65 kW, one port can deliver at most 1,560 kWh in a day, so 250 kWh is about 16% of the day, which lines up with Paren's national 15.8% to 15.9%. By the same arithmetic 175 kWh is about 11%, 430 kWh is about 28%, 470 kWh is about 30%, and 650 kWh is about 42%. The 430 and 470 rungs are in the range of the metros Paren reports above 25%, Los Angeles at 30.7% and San Diego at 26.0% in Q2 2025, and Los Angeles at 31.8% in Q3 2026. The 650 rung is a flagship site that out-runs even those metro averages, with Los Angeles reaching 38.6% in the 12 p.m. to 7 p.m. window.
Level 2 benchmarks in the tool remain occupancy-based, at 3%, 8%, and 15% of the day actively charging. They are the tool's own calibration for the destination sites discussed above, not a published national dataset, which is consistent with the data gap described earlier: no public source defines destination utilization the way Paren defines fast-charging utilization. If you model a destination site, test your payback at the 3% rung before the 15% one.
Two consequences follow. A DC fast charging site in a secondary market should be modeled near the conservative rung until its own data says otherwise, since the national average already includes the strongest metros. And when a vendor quotes you a utilization percentage, convert it: ask for kWh per port per day, then check it against the ladder above. If you want to size the port count before you model revenue, see How Many Chargers Does Your Property Need.
The destination data gap
There is no destination-site equivalent of Paren's defined national measure. The utilization ranges that circulate for multifamily, workplace, and hotel charging come from operator anecdotes and vendor case studies that rarely name the operator, the sample, the geography, or the measurement definition, so this article does not quote them. When someone offers you a destination utilization number, ask who measured it, across how many sites, over what period, and against which denominator. A number that arrives without those answers is marketing, not data.
The same discipline applies to payback claims. Payback at a destination site depends on utilization measured in energy terms, the local tariff, the pricing model, and the incentive stack, and published claims that skip those inputs cannot be checked. Build payback from your own inputs rather than borrowing an unattributed range. A new site in a lower-adoption market should still expect lower utilization for the first 12–18 months while local ownership builds.
How to read a utilization number before you trust it
Utilization is reported inconsistently across vendors and case studies, which is why two sites with identical demand can quote very different percentages. Three questions separate a meaningful number from a misleading one.
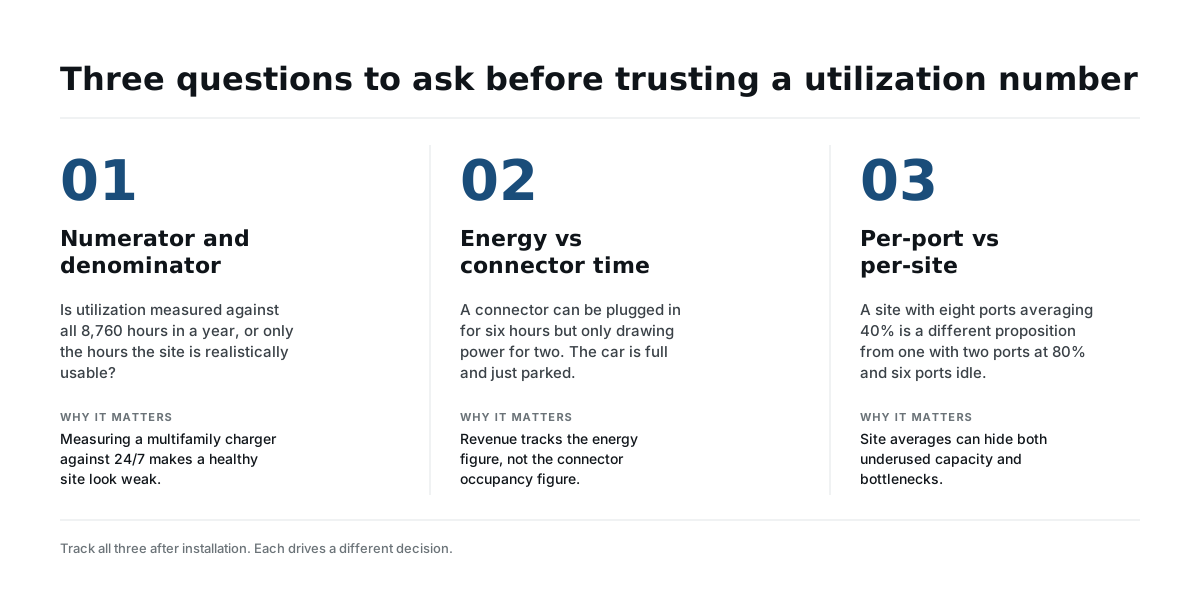
After installation, track all three on your own site. They drive different decisions: connector occupancy tells you whether to add ports, energy throughput tells you what revenue to expect, and the time-window denominator tells you whether the site is actually underperforming or just being measured unfairly.
The early-mover advantage
Properties that installed in 2020–2022, when local EV adoption was lower, are now benefiting from infrastructure they put in before demand matured. Operators considering installation today face higher equipment costs (partly offset by stronger incentive programs while they last) but also higher immediate utilization, because the local EV base already exists.
The contrast is sharpest in apartments: buildings with established charging command modest rent premiums in EV-dense submarkets, while buildings still planning are competing against an amenity they do not yet offer.
A closing incentive note
⚠️ Note: The federal 30C charger tax credit ended June 30, 2026. No federal EV charger tax credit is available for equipment placed in service after that date; budget the real out-of-pocket cost and look to state and utility programs.
Any payback you model should show its incentive assumptions explicitly. With the federal 30C charging credit now closed, the capital stack rests on state and utility programs where they exist. Model the no-incentive case as well, so the project still stands on its own economics.
What this means for earlier-stage markets
Markets at lower current adoption (parts of the Mountain West, much of the Midwest, several mid-Atlantic states) trail the high-adoption curve by a few years. The adoption and charging demand that California and Pacific Northwest operators are living today is a reasonable preview of where those markets are heading, but the timeline is a projection, not a promise. Installing now in a lower-adoption market is a bet on rising local ownership; size the project and the financing so it survives a slower-than-hoped ramp.
For the underlying revenue, cost, and utilization-sensitivity math at destination Level 2 sites, see Building a Realistic ROI Model for Commercial Level 2 Charging, which runs conservative, moderate, and mature utilization scenarios side by side. The public DCFC numbers above behave differently and follow a different model; see DC Fast Charging ROI: Why the Math Is Different for demand charges, NEVI dependency, and worked examples for corridor, retail anchor, and fleet depot sites.
California note: California's high adoption produces the strongest destination utilization, but its commercial demand charges and time-of-use tariffs (PG&E, SCE, SDG&E) raise the cost side. High occupancy helps spread fixed costs, yet a cluster of chargers drawing peak power simultaneously can trigger demand charges that erode the gains. Load management is usually necessary to convert high utilization into actual margin in California.
Last factually verified: October 13, 2026 against Paren's US EV Fast Charging reports (Full Year 2025, published January 28, 2026; Q2 2025; Q2 2026, July 14, 2026; Q3 2026, October 13, 2026) and the benchmark constants in our ROI snapshot tool. Public Law 119-21 (Section 30C) was last checked August 11, 2026. All Paren pages were reachable; the Q4 2025 figure comes from the annual report because Paren published no separate U.S. Q4 report.
evcharginghelp.com is editorially independent and receives no compensation from any company mentioned.
Update (October 13, 2026): Added Paren's 2026 national and metro figures and a section reconciling this article with the ROI snapshot tool's energy-based benchmarks (kWh per port per day, national and Southern California ladders).
Corrections (August 11, 2026): An earlier version of this article reported destination charger utilization of 50–70% at mature installations and operator payback of 3–6 years; both ranges were unattributed, with no named operator, sample, geography, tariff, pricing model, or measurement definition, and have been removed. The attributed public measure is Paren's 2025 report, which put national public DC fast-charging utilization at 16.2% in Q1 2025, rising to 16.4% in Q4, under Paren's stated tracked-time methodology; destination utilization is measured against different denominators and the two are not comparable.