Short answer for multifamily: in the 20-unit worked example below, charging revenue alone does not pay for the chargers. After $18,000 of utility make-ready on a $35,000 installation, the net cost is $17,000, the direct contribution at mature usage is about $677 a year, and the simple payback is about 25 years before costs the model omits. What can change that is how much of the install a utility or state program covers, how heavily the chargers are used, and tenant retention, which no published study has priced directly. The full build-up is in Example 1 below; for the retention evidence, see multifamily EV charging and lease renewal.
Most commercial EV charging ROI models are either too optimistic (inflated utilization assumptions, missing operating costs) or too pessimistic (ignoring incentives and indirect value). Building a model that's actually useful requires separating what you can measure from what you're estimating.
This article covers Level 2 commercial charging, which is the right model for multifamily, workplace, hotel, retail destination, and similar dwell-time use cases. DC fast charging behaves differently on almost every line of the model (demand charges, install per port, utilization baselines, NEVI dependency); for that case, see DC Fast Charging ROI: Why the Math Is Different.
The ROI framework: two buckets
⚠️ Note: The federal 30C charger tax credit ended June 30, 2026. No federal EV charger tax credit is available for equipment placed in service after that date; budget the real out-of-pocket cost and look to state and utility programs. The worked examples below were rebuilt in July 2026 without the credit, against current cost and usage data (CALeVIP project cost data, NREL EV WATTS venue benchmarks, ENERGY STAR 2024 session data, AFDC maintenance guidance).
All commercial EV charging returns fall into one of two categories: direct cash flows on the bank statement, and indirect value that has to be deliberately counted.
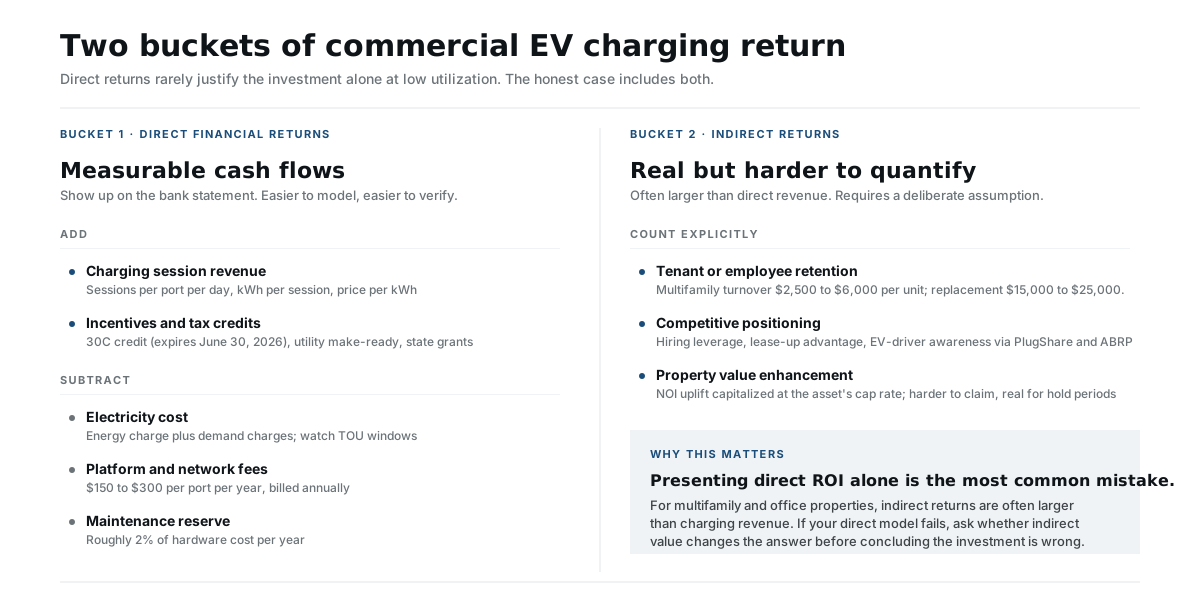
A common mistake: presenting the direct ROI as the complete picture. For many property types (especially multifamily and office), the indirect returns are larger than direct charging revenue, but they require a deliberate decision to count them, not an assumption they'll materialize.
Three worked examples
Dollar figures are computed on the exact unrounded session values the Commercial ROI snapshot models (these examples are its built-in presets); the per-day kWh lines are rounded for readability, so recomputing from the rounded lines can differ by a few dollars.
One caveat before the numbers: the examples count only electricity, platform fees, and maintenance on the cost side. They omit payment-processing fees, charging losses, fixed utility charges and riders, taxes, demand or subscription charges where applicable, downtime, equipment-replacement reserves, insurance effects, and the cost of capital. Every payback figure below is therefore a simple payback before these omitted costs; a full pro forma will land somewhat worse.
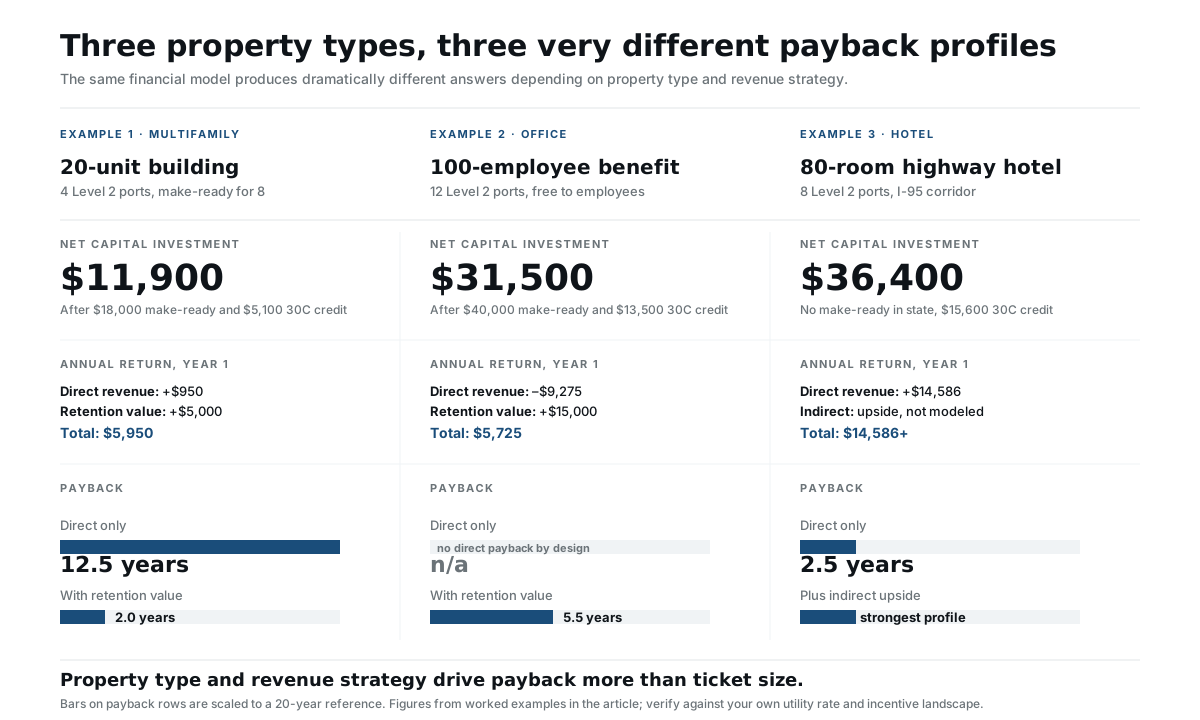
Example 1: 20-unit multifamily in a medium-adoption market
Assumptions:
- 20 apartments, 10% current EV ownership = 2 EV-owning residents
- Market EV adoption at 8%, growing to 18% in 3 years
- Installation: 4 Level 2 ports (40A), make-ready wired for 8
- Gross installation cost: $35,000 (4 chargers + infrastructure for 8; in line with CALeVIP actual project data of roughly $9,000–$10,000 per connector)
- Utility make-ready program covers infrastructure: $18,000
- Net capital investment: $17,000 (no federal credit; 30C ended June 30, 2026)
Revenue model (mature usage):
- 1.25 sessions/port/day at ~10.4 kWh per session (residential-type sessions deliver ~10–11 kWh; the median across public datasets is about 10.75 kWh)
- 4 ports × 1.25 × 10.4 kWh = 52 kWh/day
- Pricing at $0.25/kWh (as of Q2 2026) = $13/day gross
- Annual gross revenue: ~$4,744
- Less electricity at $0.13/kWh: ~$2,467/year
- Annual gross net revenue: ~$2,277
Operating costs (annual):
- Platform/network fees: $800 (4 ports × $200/port, as of Q2 2026)
- Maintenance reserve: $800 (this model reserves $400 per dual-port unit, or $200 per port; AFDC's cited owner estimates run up to $400 per charger per year, and DC fast-charging warranty and maintenance costs run higher)
- Total operating cost: $1,600
Net annual direct contribution: $2,277 – $1,600 = $677
Direct charging economics, standing alone (the headline result): $17,000 ÷ $677 = about 25 years simple payback, before the omitted costs listed above. Direct revenue does not carry this project, and no honest multifamily model should claim it does.
An illustrative retention scenario (unsupported assumption; the base case is zero):
- No published study prices retention from charging directly, so the base case for retention value is $0/year. A real estimate requires three measured inputs multiplied together: avoided move-outs per year, times the fully loaded cost per move-out, times the probability that charging caused the retention. None of the three is measured here.
- Purely to illustrate the mechanism: apartment turnover costs roughly $4,000 per move-out (2024–2025 industry benchmarks). If on-site charging were the deciding factor in one to two renewals a year, that would be worth about $5,000/year, more than seven times the site's $677 direct charging contribution. That ratio is exactly why this one unsupported input can reverse the investment decision on its own.
- As EV ownership grows to 4–6 residents by Year 3, the retention exposure grows with it
Combined return under the illustrative assumption: $677 + $5,000 = $5,677
Combined payback under the illustrative assumption: $17,000 ÷ $5,677 = 3.0 years
Do not treat the 3.0-year combined figure as the headline result unless the property has measured renewal data showing that charging actually drives retention. Until then, the defensible headline is the roughly 25-year direct payback, with retention presented as the explicitly labeled bet it is.
California note: The $0.13/kWh electricity assumption sits a little under the national average for commercial rates, which EIA put at about $0.14 to $0.145/kWh in mid-2026; California's commercial average was about $0.31. California property owners should use their actual rate schedule: SDG&E's EV-HP, SCE's TOU-EV schedules, and PG&E's BEV subscription tariff all price energy by time of use at levels well above the national average, which can substantially affect the per-session electricity cost. They also change the demand-charge picture: SCE's TOU-EV is energy-only for now, under a demand-charge holiday that is set to end, and PG&E's BEV and SDG&E's EV-HP replace the demand charge with a per-kW subscription (SDG&E's EV-HP phases toward a full demand charge between 2026 and 2032; see DC Fast Charging ROI), so the $5 to $25 per kW demand range above does not apply as stated on those rates; see How to Read Your EV Tariff Sheet for the three schedules by name. In high-rate California markets, re-run this example with your actual utility rate before drawing conclusions about payback. Your state page on this site lists the named PG&E, SCE, SDG&E, and LADWP residential and commercial EV programs in each service territory.
Example 2: 100-employee office, employee benefit model
Assumptions:
- 100 employees, 20% own EVs = 20 EV-driving employees
- Employer provides free charging as a benefit (still the dominant workplace model per DOE's 2025 workplace charging guidance)
- Installation: 12 Level 2 ports (40A), standard installation
- Gross installation: $85,000 (12 chargers + electrical; large projects share trenching and panel work, so the per-port cost lands below smaller sites)
- Utility make-ready program: $40,000 covered
- Net capital investment: $45,000 (no federal credit; 30C ended June 30, 2026)
Revenue model: None; employer-subsidized, free to employees.
Operating costs (annual):
- Electricity: 12 ports averaging one ~10 kWh session per port-day (ENERGY STAR's 2024 average for public L2 is 0.66 sessions/day; workplaces run above that on weekdays and near zero on weekends) = ~43,800 kWh × $0.12/kWh = $5,257
- Platform fees: $2,400 (12 ports × $200)
- Maintenance reserve: $2,400 ($400 per dual-port unit, or $200 per port; AFDC's cited owner estimates run up to $400 per charger per year)
- Total annual operating cost: $10,057
Direct charging economics, standing alone (the headline result): with no charging revenue, the site runs at –$10,057 per year before the omitted costs listed above. The direct charging economics are negative; there is no payback on direct cash flows at any horizon.
An illustrative retention scenario (unsupported assumption; the base case is zero):
- No published study prices employee retention from workplace charging, so the base case for retention value is $0/year. A real estimate requires three measured inputs multiplied together: avoided exits per year, times the fully loaded cost per exit, times the probability that charging caused the retention. Surveys (J.D. Power 2025, FLO 2024) show workplace charging moves satisfaction and job-choice sentiment, but none of those three inputs is measured here.
- Purely to illustrate the mechanism: replacing one mid-level employee costs $15,000–$25,000 in recruiting, onboarding, and productivity loss (the conservative end of SHRM's salary-multiple replacement-cost guidance). If the charging benefit retained even 1 EV-driving employee who would otherwise leave, that would be worth $15,000/year.
Net annual position under the illustrative assumption: –$10,057 operating + $15,000 retention value = +$4,943
Combined payback under the illustrative assumption: $45,000 ÷ $4,943 = 9.1 years
Do not present the 9.1-year combined figure as the headline result unless the company has measured employee-exit data tying retention to the benefit; the headline is that the charging economics are negative and the spend is a deliberate benefits decision. For a 100-person tech company spending $15M/year on compensation, the $10,057 annual operating cost for EV charging is rounding error in the benefits budget, with retention upside. A negative-cash-flow amenity justified by a soft benefit is a culture-and-talent decision, not a financial one, and it is more honest to present it that way.
Example 3: Highway-adjacent hotel, 8 Level 2 ports
Assumptions:
- 80-room hotel on I-95 corridor
- 8 Level 2 ports (40A), guest parking area
- Gross installation: $60,000 ($7,500/port; CALeVIP's average for 8-plus-connector projects is ~$9,100/connector on a California cost basis, so this assumes a favorable site)
- No make-ready program in this state
- Net capital investment: $60,000 (no federal credit; 30C ended June 30, 2026)
Revenue model (charging sessions):
- 1.5 sessions/port/day × 12 kWh average (11.99 kWh exactly: a 78.9-minute session at ~9.1 kW delivered on a 40A port) = 18 kWh/port/day. This is a WELL-POSITIONED site: measured L2 venue averages run only 5.8 to 10.6 kWh/port-day (NREL EV WATTS), so 18 assumes strong highway positioning and growing volume
- 8 ports × 18 kWh = 144 kWh/day
- Pricing: $0.40/kWh gross (hotels charge $0.20–$0.50/kWh; a highway-positioned property with captive overnight demand prices in the upper half of that band)
- Revenue: ~$58/day, $21,011/year
- Less electricity at $0.14/kWh: $7,354/year
- Gross net: $13,657/year
Operating costs (annual):
- Platform/network fees: $1,600 (8 ports × $200)
- Maintenance: $1,600 ($400 per dual-port unit, or $200 per port; AFDC's cited owner estimates run up to $400 per charger per year)
- Total: $3,200
Net direct annual contribution: $13,657 – $3,200 = $10,457
Payback on direct revenue (simple payback before the omitted costs above): $60,000 ÷ $10,457 = 5.7 years. This is the strongest direct-revenue profile of the three L2 examples, and the only one that works on charging revenue alone. Note what carries it: pricing, not volume. At a conservative $0.30/kWh the same site takes 11.5 years, so the difference between a workable hotel project and a decade-long one is almost entirely pricing power, and the 2-to-3-year L2 paybacks in vendor marketing still assume session volumes no measured dataset supports.
What actually improves it:
- Pricing structure: many hotels use $10–$25 flat overnight fees instead of per-kWh pricing, which prices a full overnight charge above even $0.50/kWh for typical sessions
- Hotel appears in EV trip-planning apps (PlugShare, ABRP), which generates awareness-level traffic and incremental bookings
- Some guests add a night specifically to fully charge before continuing → incremental room revenue
The highway corridor location is key; this only works for hotels with road-trip-relevant positioning and the pricing power that comes with it. A hotel that has to price at commodity rates to compete should model itself like the destination-retail case, not this one.
Sensitivity analysis: what changes the payback
Utilization is the variable that matters most in the direct revenue model. Define it honestly first: throughout this article, utilization means ACTIVE-CHARGING port occupancy, the share of the 24-hour day a port spends actually delivering energy. By that definition, measured public L2 runs about 3 to 5 percent today (NREL EV WATTS venue data works out to 5.8 to 10.6 kWh/port-day, assuming 40A ports delivering ~9 kW; slower average delivery means slightly higher occupancy for the same energy), a well-positioned destination site reaches ~8 percent, and ~15 percent is top-tier. Older guidance quoting 40 to 65 percent "utilization" was using a looser definition and should not be compared against these numbers.
Example: the 8-port destination site from Example 3 ($60,000 net capital, $0.40/kWh pricing, $0.14/kWh electricity cost, both as of Q2 2026)
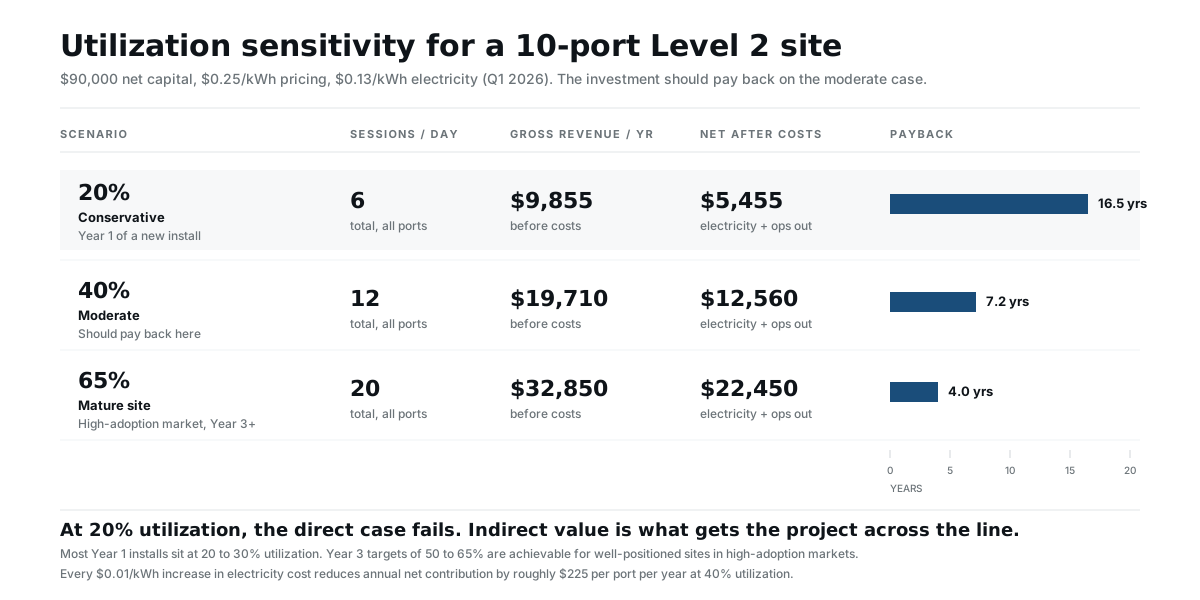
At 3% occupancy, today's typical case, the project technically covers its operating costs but a 33.6-year payback is no payback in practice, which is why it is critical to include indirect value. At 8% it works well; at 15% it is excellent. Notice that this ladder is priced at the hotel's $0.40/kWh: at commodity pricing every rung roughly doubles. L2 volume has been growing roughly 30% a year network-wide, so the realistic bet is that a well-positioned site climbs this curve over several years.
Sensitivity to electricity rate: Every $0.01/kWh increase in electricity cost reduces annual net contribution by approximately $64/port/year at 8% occupancy. If your utility is raising rates, build escalation into your model.
Sensitivity to incentives: If a state grant or utility rebate disappears before your project closes, your net capital rises by the incentive amount. The federal 30C credit is already gone, so model the "no incentives" case as your worst-case payback to confirm the project still makes sense on its own.
Common model errors
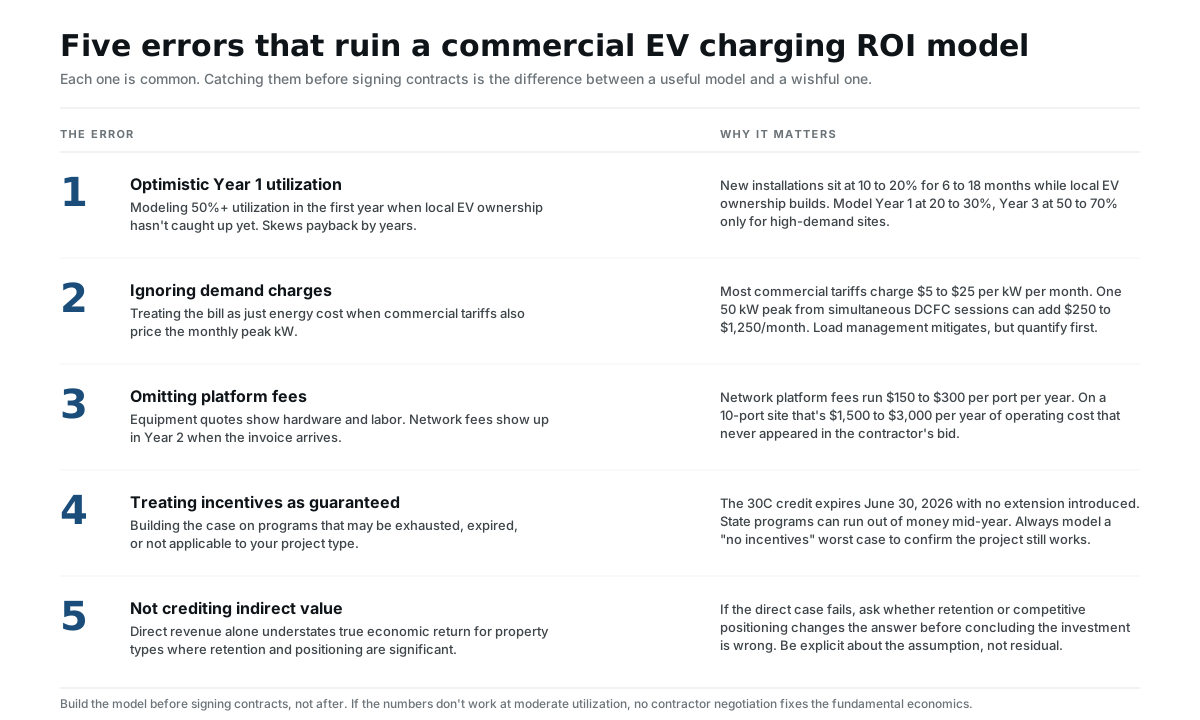
Optimistic utilization. Measured L2 sites average a few percent active-charging occupancy (5.8–10.6 kWh/port-day across venues, NREL EV WATTS); new installations start below even that for 6–18 months while local EV ownership builds. Model Year 1 at a fraction of your mature target, and treat a mature target above ~8% occupancy as something your location has to earn.
Ignoring demand charges. Commercial electricity customers pay demand charges (monthly fee based on peak kW draw). A cluster of chargers starting simultaneously can spike demand substantially. Load management software mitigates this, but quantify the exposure before finalizing the model.
Omitting platform fees. Network platform fees are real operating costs, and current pricing is quote-based, varying by SKU, term, and included services. They don't show up in equipment quotes; they show up in year 2 when you get the invoice.
Treating incentives as guaranteed. Verify that incentive programs are currently funded and accepting applications before building your model around them. Programs that existed last year may be exhausted this year. The federal 30C tax credit in particular ended June 30, 2026, so do not model it as available for any project placed in service after that date.
Not crediting indirect value. The direct revenue model alone understates true economic return for multifamily, office, and hospitality properties where retention and competitive positioning are significant. If your direct model doesn't work, ask whether indirect value changes the answer before concluding the investment is wrong.
The model structure you should use
Build your model with these rows:
Capital:
- Gross project cost (hardware + installation)
- Less: utility make-ready / grants (verify currency on your state page, which lists current residential and commercial incentives by state; see Utility EV Charger Rebates: A Growing Incentive Layer for the broader utility-side pattern)
- Less: 30C tax credit (the federal 30C credit ended June 30, 2026 and no longer applies to new projects; omit this row)
- = Net capital investment
Annual revenue: Sessions × kWh × price per kWh (or per-minute equivalent)
Annual costs: Electricity + platform fees + maintenance reserve
Net direct contribution: Revenue minus costs
Indirect value: Retention + competitive positioning (explicit assumption with a zero base case, not a residual; retention = avoided move-outs or exits × fully loaded cost per event × probability charging caused the retention)
Total annual return: Direct + indirect
Payback: Net capital ÷ total annual return
NPV (optional): For multi-year analysis, discount at your hurdle rate
Run three utilization scenarios: 3% active-charging occupancy (typical today), 8% (well-positioned), 15% (top-tier). The investment should pay back on the well-positioned case, or on indirect value that you are willing to state explicitly, not only on the top-tier case.
If you would rather not build the spreadsheet by hand, the Commercial ROI snapshot runs this exact model in your browser. The worked examples above are built in as presets, so you can start from the closest one, change the assumptions to match your property, and share the URL or print the one-page result for your board or CFO.
A note on timing: when to model vs. when to decide
The model is a decision tool, not a precision instrument. Real-world outcomes will differ from any projection. The value of the model is forcing explicit assumptions, particularly on utilization and indirect value, so you're making a deliberate bet rather than acting on optimism.
A project with a decade-long direct payback and meaningful tenant retention value is almost certainly worth doing for a multifamily owner with a 20-year hold period. A project with a 25-year direct payback and no credible indirect value story is almost certainly not. Most projects fall clearly on one side of that line once the model is built honestly.
Build the model before signing contracts, not after. If the numbers don't work at moderate utilization, no amount of contractor negotiation fixes the fundamental economics.
Last factually verified: 2026-10-04 for the commercial electricity average (EIA Electric Power Monthly, Table 5.6.A), the 30C end date (IRS Form 8911 instructions), utilization benchmarks (ENERGY STAR, NREL EV WATTS), the AFDC maintenance figure, and California EV rate structures; the rest was last verified 2026-07-19. Worked examples rebuilt against CALeVIP actual project cost data (CEC), NREL EV WATTS venue session data, ENERGY STAR 2024 EV charging technical reference, AFDC operations and maintenance guidance, EIA commercial electricity rates, SHRM employee replacement cost benchmark, and 2024–2025 multifamily turnover cost benchmarks.
Corrections (August 11, 2026): This article previously presented the multifamily example's 3.0-year payback, which relied on an assumed $5,000 per year of tenant-retention value, and the workplace example's 9.1-year payback, which relied on an assumed $15,000 per year of employee-retention value, as the headline results. The direct charging economics are about a 25-year simple payback for the multifamily case and negative for the workplace case; the retention values are unsupported illustrative assumptions with a base case of zero (a real estimate requires avoided move-outs or exits, times the fully loaded cost per event, times the probability that charging caused the retention), and the combined paybacks should not be treated as headline results without measured renewal or employee-exit data.