Most commercial EV charging ROI guidance is written for Level 2. The math, the worked examples, the utilization assumptions, and the operating-cost lines all reflect destination-style charging where a session lasts hours and the building owner is selling parking-with-charging more than they are selling electricity. DC fast charging behaves differently on almost every line of the model. Sessions are 20 to 40 minutes, peak draw per port can hit 150 to 350 kW, demand charges become a major operating cost, install costs run 10 to 25 times higher per port, and the federal reference case for public utilization is 8 percent of the day (NREL's 2025 Transportation ATB), well above the few percent of active-charging occupancy that measured L2 sites actually run.
If you came here from the Level 2 ROI model, the structure of this article will be familiar. The framework is the same. The numbers are not.
The ROI framework: still two buckets, but the indirect bucket is thinner
⚠️ Note: The federal 30C charger tax credit ended June 30, 2026. No federal EV charger tax credit is available for equipment placed in service after that date; DCFC unit economics now rest on NEVI and state grants plus the direct revenue case, not the federal charger credit. The worked examples below were rebuilt in July 2026 without the credit, against real NEVI award cost data and 2025 operator session benchmarks.
Like Level 2 ROI, DCFC ROI splits into direct cash flows and indirect value. The composition is different.
The direct bucket is bigger and busier. DCFC charges by the kWh or by the minute at higher rates than L2, draws more energy per session, and incurs operating costs (especially demand charges) that L2 does not. It is the dominant part of the case at almost every public DCFC site.
The indirect bucket is thinner. Retention and lease-up value, which carry the L2 case at multifamily and office sites, mostly do not apply at public DCFC. The site host does not benefit from a renewing tenant; the buying decision is the road-tripping driver who stops once. The exceptions are real but narrow: hotels and retail anchors where DCFC drives incremental visits, and fleet depots where the indirect value is the fleet electrification decision itself.
That asymmetry sets the bar. Most public DCFC sites have to pencil on direct revenue plus federal and state subsidy. There is rarely a soft retention story big enough to save a weak direct case.
The four numbers that drive DCFC payback
Four assumptions decide whether a DCFC site works. Get any of these wrong by half and the model is meaningless.
Revenue per kWh
Public DCFC pricing typically runs $0.40 to $0.65 per kWh as of Q2 2026, with premium high-power sites at the top of that band and value-priced corridor sites at the bottom. Per-minute pricing is common where state law restricts per-kWh billing; see Pricing Commercial EV Charging for the legal landscape and the speed-fairness tradeoff. Fleet off-take agreements run lower, typically $0.25 to $0.40 per kWh on negotiated rates.
Utility cost per kWh, plus demand charges
The energy cost is straightforward and not very different from L2: commercial rates averaged about $0.14 to $0.145/kWh nationally in mid-2026 (EIA), and far higher in California and the Northeast. The worked examples below use $0.13/kWh, so at the national average their electricity lines run roughly 10 percent higher. Demand charges are where DCFC departs sharply from L2. Commercial customers pay a monthly fee based on peak kW draw, typically $5 to $25 per kW per month depending on utility. A single 350 kW DCFC port at peak draw, in a $15/kW market, adds $5,250 per month in demand charges before a single kWh moves. A four-port site with a coincident peak of 400 kW costs $6,000 a month in demand charges alone in that market. Load management software, which staggers session starts and caps simultaneous draw, can reduce coincident peak by 30 to 60 percent and is usually mandatory at any site with more than two ports.
Hardware and install per port
DCFC sites cost $90,000 to $200,000 per port all-in as of 2026, depending on site conditions and utility upgrade requirements. The best available benchmark is real money: across 330 winning NEVI applications, the median total project cost works out to about $183,000 per port and the mean about $193,000 (Paren, 2024); best-in-class metro operators building many stalls at once report gross costs near $85,000 to $90,000 per stall, which is the efficient floor, not the typical single-site outcome. The components are roughly: hardware $35,000 to $70,000 per port; civil and trenching $10,000 to $30,000 per port (lower with shared infrastructure across multiple ports); electrical service and switchgear $15,000 to $40,000 site-wide; transformer or utility service upgrade $20,000 to $200,000 site-wide if required. The transformer line is the most common path to the upper bound of the range; sites that already have 3-phase service near the parking area land closer to the lower bound.
NEVI funding covers up to 80 percent of cost on corridor-eligible sites, and the FHWA grant programs (NEVI and, where eligible, CFI) are now the only federal levers: the 30C credit ended June 30, 2026. On a $740,000, 4-port site with an 80 percent NEVI award, the net capital to the owner is $148,000. On the same site without NEVI, net capital is the full $740,000. The grant is the difference between a project and a non-starter.
Utilization
Use 8 percent as your reference case: that is the current public DCFC utilization reference in NREL's 2025 Transportation Annual Technology Baseline (based on Borlaug et al. 2022), and it is the right federal benchmark to plan against. Then run sensitivities at 4, 8, and 16 percent. The 16 percent figure is not a general national average and not a default planning input; it is one named measure: Paren's 2025 report put national utilization at 16.2 percent in Q1, rising to 16.4 percent in Q4, under its stated tracked-time methodology covering more than 95 percent of U.S. DCFC infrastructure. A well-located corridor site in a high-traffic state can reach 20 to 30 percent at maturity (Year 3 or later); a fast-casual retail location in a moderate-adoption market typically lands 10 to 18 percent. Treat anything above 25 percent in your model as a high-confidence achievement that has to be earned by location and operations, not assumed.
Three worked examples
These three sites are the most common shapes for a commercial DCFC investment today. Dollar figures are computed on the exact unrounded session values the Commercial ROI snapshot models (these examples are its built-in presets); per-day lines are rounded for readability, so recomputing from them can differ by a few dollars. The math uses 2026 cost and revenue benchmarks; your numbers will move with site conditions, utility rates, and grant outcomes.
A scope caveat that applies to all three: the operating-cost lines cover electricity, demand charges, platform fees, and maintenance. They omit payment processing, charging losses, taxes and riders, fixed utility charges, downtime, equipment-replacement reserves, and the cost of capital, and the NEVI case books the grant as an immediate capital offset even though reimbursement timing, compliance cost, and contingency risk are not modeled. Every payback figure below is therefore an unlevered simple payback before these omitted costs, and the no-grant case is the primary baseline for a private investment decision.
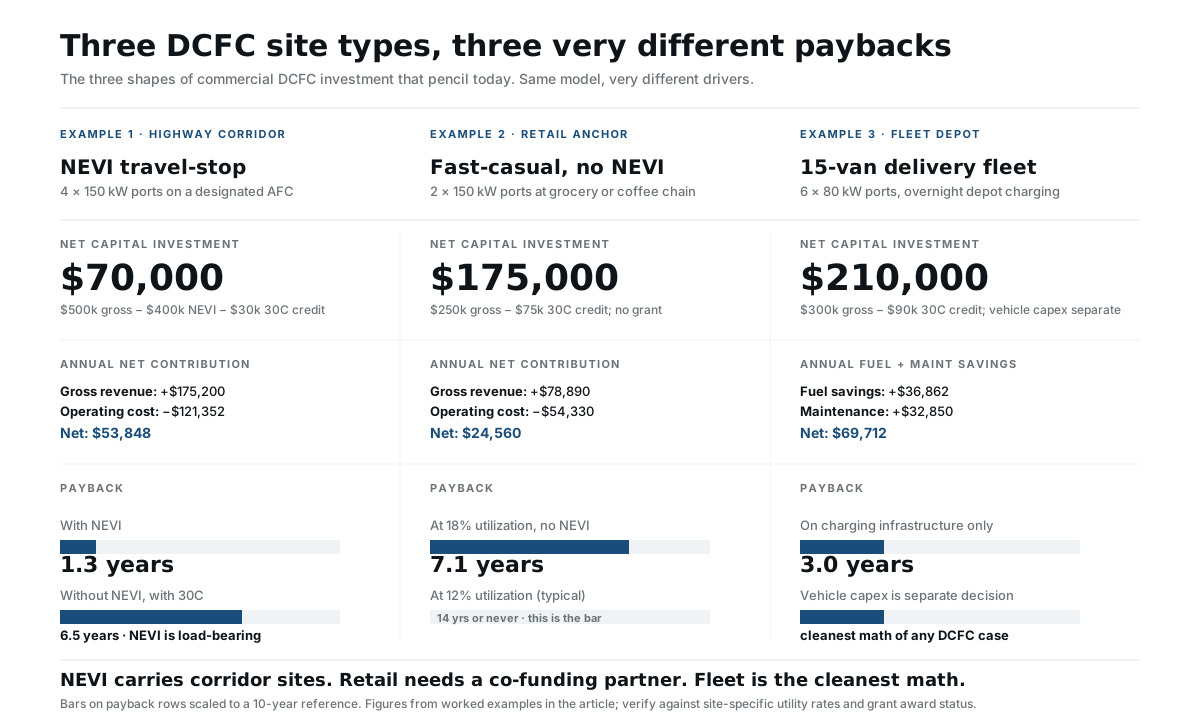
Example 1: NEVI-funded highway corridor travel-stop
Assumptions:
- 4 × 150 kW DCFC ports at a truck-stop on a designated Alternative Fuel Corridor
- Gross install: $740,000 ($185,000 per port, in line with the roughly $183,000 median across 330 winning NEVI applications; $125,000/port sites exist but sit in the bottom quartile)
- NEVI grant (80 percent of eligible cost): $592,000
- Net capital: $148,000 (no federal credit; 30C ended June 30, 2026)
Revenue model at mature corridor volume:
- 7.5 sessions per port per day, averaging 34 kWh delivered (2025 operator data: corridor-heavy networks run 7.5 to 10 sessions per stall-day at about 33 to 37.5 kWh per session)
- Daily energy: roughly 255 kWh per port, or 1,020 kWh site-wide
- Annual delivery: about 372,000 kWh
- Pricing: $0.50/kWh (the 2025-2026 national public DCFC average sits at $0.47 to $0.53)
- Gross annual revenue: $186,177
Operating costs (annual):
- Electricity at $0.13/kWh: $48,406
- Demand charges (~350 kW managed peak × $15/kW × 12 months): $62,996
- Platform and network ($1,200/port × 4): $4,800
- Maintenance and uptime reserve: $8,000 ($2,000/port, inside the published $1,000 to $3,000 per DCFC per year band)
- Total operating cost: $124,202
Net annual direct contribution: $61,975
Start with the private-investment baseline, the site with no grant, where the owner covers the full $740,000 install:
Unlevered simple payback before omitted costs, no grant (the primary baseline): $740,000 ÷ $61,975 = 11.9 years
Now layer in the 80 percent NEVI award, which cuts the owner's net capital to $148,000, remembering that the model books the grant as an immediate capital offset and does not model reimbursement timing, compliance cost, or contingency risk:
Unlevered simple payback before omitted costs, with NEVI: $148,000 ÷ $61,975 = 2.4 years
The takeaway is uncomfortable but it is the actual shape of the market: NEVI funding is what makes most corridor DCFC pencil today. A 2.4-year payback is a strong project; a 12-year payback usually is not. If you are planning a corridor site, NEVI is not a nice-to-have. It is load-bearing. Confirm your state's solicitation status before committing capital. See Federal EV Charging Funding: NEVI, CFI, and IRA Programs for current program status, and check your state page for the corridor sites, utility EV rate programs, and stackable state grants specific to where you operate.
Example 2: Fast-casual retail anchor (no NEVI)
Assumptions:
- 2 × 150 kW DCFC ports at a grocery anchor or coffee chain in a moderately high-traffic suburb
- Site is not on a designated AFC, so NEVI does not apply
- Gross install: $280,000 ($140,000 per port; a 2-port site cannot share utility service and switchgear the way a 4-port site does)
- Host site-work contribution: $100,000 (the retail anchor covers the civil and electrical infrastructure as a traffic-driving amenity; this cost-share is the standard structure for retail DCFC, not a bonus)
- Net capital investment (operator): $180,000 (no federal credit; 30C ended June 30, 2026)
Revenue model at strong retail volume (Year 3 mature):
- 9 sessions per port per day, averaging 26 kWh (grocery-anchored stations run a median of roughly 7 to 8 sessions per port-day, with shorter top-up sessions than corridor stops)
- Daily energy: about 234 kWh per port, or 468 kWh site-wide
- Annual delivery: about 170,800 kWh
- Pricing: $0.49/kWh
- Gross annual revenue: $83,686
Operating costs (annual):
- Electricity at $0.13/kWh: $22,202
- Demand charges (150 kW managed peak × $15/kW × 12 months): $27,000
- Platform and network: $2,400
- Maintenance reserve: $4,000
- Total operating cost: $55,602
Net annual direct contribution: ~$28,083
Unlevered simple payback before omitted costs: $180,000 ÷ $28,083 = 6.4 years
The deal structure is doing real work in that number. Remove the host contribution and the operator carries the full $280,000 against the same $28,083, which is a 10-year payback at STRONG volume, a well-anchored site running near the top of the measured retail range. That gap is why pure operator ownership rarely works at retail without grant funding, and why the cost-share is the standard structure: the retail anchor covers the civil and electrical work in exchange for traffic-driving signage, the operator covers the chargers, and each side's payback works on its own share. An EV-specific utility rate that removes the demand charge moves the site further still: zeroing the $27,000 demand line takes the co-funded site to about a 3.3-year payback.
Example 3: Fleet depot DCFC
Assumptions:
- 20-van light-duty delivery fleet, about 79 miles per van per day, returns to a central depot nightly and shares the DC ports (real depots cycle 2 to 6 light-duty vehicles per port per day)
- 6 × 80 kW DCFC ports (lower kW than public DCFC because overnight charging allows it)
- Gross install: $300,000 ($50,000 per port, lower per-port cost from shared infrastructure and smaller transformer needs; 60 to 80 kW hardware now lists around $24,000 to $40,000 per unit)
- Net capital investment: $300,000 (no federal credit; 30C ended June 30, 2026)
Operating savings (the return source):
- Annual fleet mileage: about 579,000 miles (251,850 kWh delivered at 2.3 miles per kWh, a realistic cargo-van efficiency)
- Gasoline baseline at 14 mpg, $4.465/gallon (EIA U.S. regular, week of September 28, 2026): about $184,741 annual fuel avoided
- Maintenance savings (EV vs gasoline, ~$0.04/mile, Argonne National Laboratory): about $23,170
- Gross avoided cost: $207,911/year
Charging operating costs (annual):
- Electricity: 251,850 kWh at $0.13/kWh: $32,741
- Demand charges (6 × 80 kW × 0.5 load management × $10/kW × 12 months): $28,800
- Platform: $7,200
- Maintenance reserve: $12,000
- Total operating: $80,741
Net annual benefit: $207,911 − $80,741 ≈ $127,170
Unlevered simple payback on charging infrastructure, before omitted costs: $300,000 ÷ $127,170 = 2.4 years
Gasoline prices move, and this example moves with them. At $3.15 a gallon, the price this example used in mid-2026, avoided fuel drops to about $130,332 and the payback stretches to 4.1 years. Rerun the fuel line at your fleet's actual fuel cost before you rely on the result.
An honesty note on the baseline: an earlier version of this example assumed a diesel fleet at $4.50 per gallon, passenger-car electric efficiency, and an $0.08/mile maintenance delta, which roughly doubled the per-mile savings. The numbers above use a gasoline van baseline at the latest weekly EIA price, van-class efficiency, and Argonne's published maintenance delta. Fleet depot charging still has the cleanest DCFC math, but it earns that title at real fleet mileage, not through an optimistic baseline.
A critical caveat: the $127,170 annual benefit is real, but only if the fleet electrification decision is already made. The vehicle replacement capex is a much larger number and is not part of charging ROI. If you are evaluating whether to electrify the fleet at all, see Fleet Electrification ROI: Early Adopters Report Faster Paybacks Than Projected, which models the full vehicle plus charging investment. The example here is the charging infrastructure ROI in isolation, which is the cleanest math of any DCFC use case because it has guaranteed users, controllable utilization, and quantified fuel savings.
Demand-charge sensitivity
Demand charges are the variable that most often surprises a first-time DCFC operator. A 350 kW site that performs strongly on energy delivery can still lose money if peak draw is unmanaged and the utility's demand-charge tariff is aggressive.
The math: total demand charge per year = managed peak kW × demand rate × 12 months. For a 4-port, 150 kW DCFC site running at a coincident peak of 350 kW (after load management), demand charges scale linearly with the utility's tariff and quickly become the dominant operating cost line.
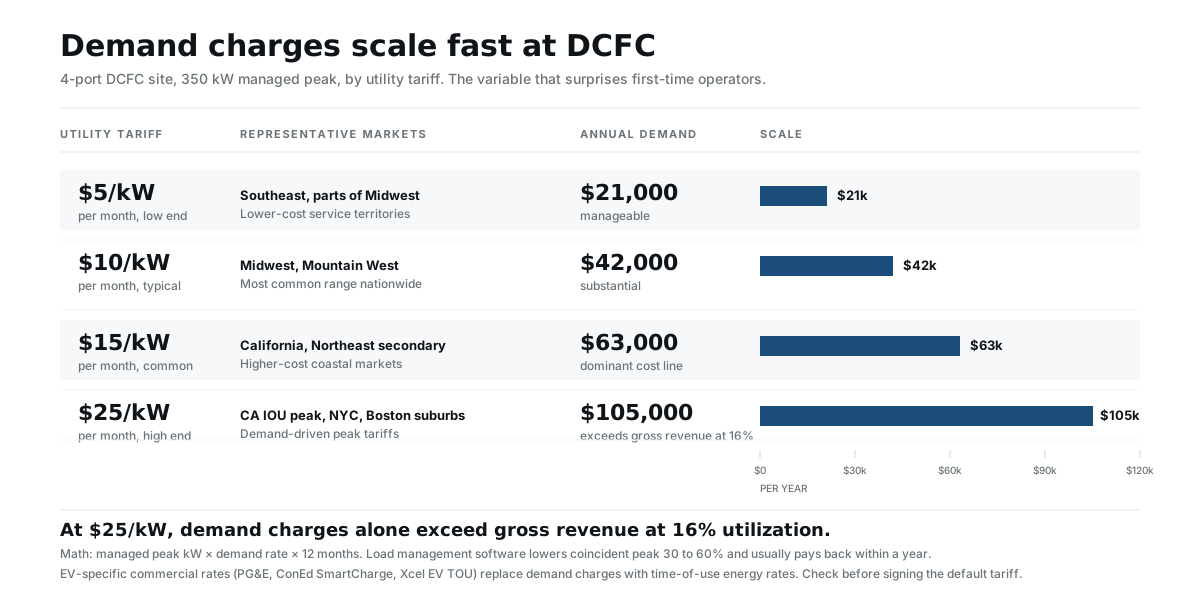
Load management software, which can lower coincident peak by 30 to 60 percent through staggered starts and dynamic throttling, is the standard fix and usually pays for itself within a year at any site over two ports. Expect to budget $1,000 to $5,000 per year for load-management software at a multi-port DCFC site.
The other lever is rate selection. Many utilities offer EV-specific commercial rates that replace demand charges with time-of-use energy rates or cap them at a lower kW threshold. In California, all three large utilities have one: SCE's TOU-EV is energy-only for now, under a demand-charge holiday that is set to end, while PG&E's BEV and SDG&E's EV-HP replace the demand charge with a per-kW subscription bought in blocks. SDG&E's EV-HP is transitional: it phases toward a full demand charge between 2026 and 2032, so model the later years, not just year one. Con Edison's EV Phase-In Rate takes a different route, phasing demand charges in as a site's utilization grows. On these rates, the demand-charge figures in the chart above do not apply as drawn. Check whether your utility has an EV-specific commercial rate before signing up for the default tariff; the rate election is often the single most impactful operating-cost decision you will make. Your state page lists the named utility programs in your service territory, and Utility EV Charger Rebates: A Growing Incentive Layer covers the broader pattern of utility-side EV programs (rebates, managed-charging credits, and EV-specific tariffs) that commercial DCFC operators can often opt into.
Common DCFC ROI model errors
The L2 ROI article has its own list of errors. These are the ones specific to DCFC, in rough order of how often they sink a model.
Ignoring demand charges. This is the most common DCFC modeling error. Operators build a revenue projection from kWh delivered, subtract electricity at the per-kWh rate, and treat the result as net contribution. On a standard demand tariff, the actual demand-charge line can be $30,000 to $100,000 a year on a multi-port site, which often turns a "positive" model negative. Always model demand charges explicitly, using your utility's actual tariff at your expected coincident peak.
Modeling without the NEVI subsidy at corridor sites. If your site is corridor-eligible, NEVI funding is the only realistic path to acceptable payback. A model that assumes NEVI is denied is not a "conservative case"; it is the case where you should not build. The realistic model is "what happens if NEVI is delayed by 6 months" or "what happens if our award is at 60 percent of cost instead of 80 percent," not "what happens with zero grant funding."
Assuming corridor utilization without a traffic study. A site near an AFC exit does not automatically attract drivers. The locations that achieve 20 to 30 percent utilization are the ones with high traffic counts, good visibility, services drivers actually want during a charge (food, restrooms, retail), and minimal nearby competition. A NEVI-funded site at a poor location can still operate at 8 to 12 percent utilization and never reach payback. Buy a traffic study before you commit, or partner with an established operator who already has location data.
Conflating L2 unit economics. Numbers from the L2 model do not translate. The L2 article's $0.25/kWh pricing, $0.13/kWh energy cost, and 3 to 15 percent active-charging occupancy ladder look superficially similar to DCFC inputs but lead to completely different conclusions because they exclude demand charges and assume a longer dwell-time sales mechanism. Build the DCFC model from DCFC benchmarks.
Misreading the 30C per-port cap. This one is historical now, relevant only to property placed in service by June 30, 2026 (returns still being filed or amended). The 30C cap of $100,000 applied to the credit allowed per port, not to the basis; the common error was treating it as a basis cap. At typical DCFC per-port costs, the cap did not bind: a 4-port site at $150,000 per port had $600,000 of eligible basis and, assuming prevailing wage and apprenticeship compliance (the 30 percent rate required it; the base rate was 6 percent), earned the full $180,000 credit, comfortably under the $400,000 site cap. The cap only bound at per-port costs above roughly $333,000.
Treating NEVI status as static. NEVI was frozen for much of 2025. The January 2026 ruling in Washington v. U.S. Department of Transportation barred the department from withholding funds from the 20 states and D.C. that sued; it was not a nationwide release. Then the Consolidated Appropriations Act, 2026, signed February 3, 2026, redirected about $879 million in unobligated NEVI money to other highway programs, including about $504 million from the states' formula balances, and as of the September 2, 2026 stopgap spending law, Congress has provided no NEVI money for fiscal 2027. Several states have reopened solicitations since, but timing, rules, and remaining balances are less settled than they were before the freeze; confirm your state still has an unobligated balance before you price in an 80 percent award (where NEVI funding stands). Build a contingency for "what if our state's next NEVI round is six months later than expected" into the timeline. The federal 30C credit is no longer a factor in that timing; it ended June 30, 2026.
The model structure you should use
Build your DCFC model with these rows:
Capital:
- Gross project cost (hardware, civil, electrical, transformer if needed)
- Less: NEVI or CFI grant (if applicable, model 60 to 80 percent depending on your state's actual award rates)
- Less: state and utility programs (verify currency on your state page, which lists current residential and commercial incentives by state; see Utility EV Charger Rebates: A Growing Incentive Layer for the broader pattern, and Stacking Incentives for the basis-reduction math that applied when 30C could still be layered)
- Less: 30C tax credit (the federal 30C credit ended June 30, 2026 and no longer applies to new projects; omit this row)
- = Net capital investment
Annual revenue: Active hours per port × peak draw × utilization factor × $/kWh, or per-minute equivalent
Annual costs:
- Electricity (kWh × utility rate, ideally on an EV-specific tariff)
- Demand charges (managed coincident peak × $/kW × 12)
- Platform and network fees
- Maintenance and uptime reserve (DCFC needs higher reserves than L2; budget 3 to 5 percent of hardware annually)
- Load management software subscription
Net direct contribution: Revenue minus costs
Indirect value: Usually zero for public DCFC. Material at hotels and retail anchors where DCFC drives incremental visits; quantifiable for fleet depots through fuel and maintenance savings.
Total annual return: Direct plus any indirect
Payback: Net capital ÷ total annual return
Run three utilization scenarios: 4 percent (below-reference), 8 percent (the NREL 2025 Transportation ATB reference case for public DCFC), and 16 percent (Paren's tracked-time national measure, a strong outcome, not a default planning input). The investment should pay back on the moderate case if you are going to commit. If only the optimistic case works, you are not building an investment, you are buying a lottery ticket on traffic.
If you would rather not build it by hand, the Commercial ROI snapshot runs this model in your browser and reproduces the corridor, retail-anchor, and fleet-depot examples above as presets. Start from the closest one, change the inputs to match your site, and share the URL or print the one-page result.
When DCFC actually pencils
Three site types pass an honest DCFC ROI model today:
NEVI-funded highway corridor sites with strong traffic. The 80 percent grant carries the case. The remaining 20 percent plus operating cost pencils at most corridor sites with adequate utilization and a traffic study to back the assumption. Without NEVI, the math fails for almost all corridor sites.
High-traffic retail anchors with a co-funding partner. Grocery, coffee, and quick-casual chains in the top quartile of EV-driver traffic can support DCFC payback near a decade on pure operator ownership, but the workable structure has the site host covering most of the civil and electrical infrastructure as a traffic-driving amenity. The operator covers the chargers and runs the site. Pure operator ownership rarely works at retail without grant funding.
Fleet depots where the fleet electrification decision is independent. Charging infrastructure pays back in roughly 2.4 to 4.1 years on fuel and maintenance savings at real fleet mileage, depending on the price of gasoline, if the vehicles are already being purchased. The charging side is the easy half of a fleet electrification decision; the vehicle capex is the hard half. See Fleet Electrification ROI for the integrated investment.
Other DCFC site types (suburban office, low-traffic retail, secondary highway exits) generally do not pencil today. The combination of demand charges, install costs, and modest utilization makes the math harder than the public conversation suggests. For the inverse cases (when EV charging of any type does not pencil), see When EV Charging Doesn't Make Sense for Your Property.
The DCFC investment thesis is real, but it is narrower than the equivalent thesis for Level 2. Build the model honestly before signing contracts, run the no-NEVI scenario before counting on grant funding, and price demand charges into the operating cost line from day one. The sites that do these three things and still pencil are the ones worth building.
Last factually verified: 2026-10-04 for the fleet fuel price (EIA weekly U.S. regular gasoline), the NEVI status (the Washington Attorney General's summary of the January 2026 ruling and the Consolidated Appropriations Act, 2026), EIA commercial electricity averages, and California EV rate structures; the rest was last verified 2026-07-19. Worked examples rebuilt against real NEVI award cost data (Paren analysis of 330 winning applications, 2024; state DOT award rounds through late 2025), 2025 operator session and throughput reporting (Tesla, Electrify America, EVgo quarterlies; Paren quarterly utilization), NREL 2025 Transportation Annual Technology Baseline utilization reference (Borlaug et al. 2022), Argonne National Laboratory EV maintenance cost findings, EIA commercial electricity rates, and utility commercial demand-charge tariffs. Operating cost figures and payback ranges are illustrative; site-specific outcomes depend on traffic, utility tariff, and grant award rates.
Corrections (August 11, 2026): The corridor, retail-anchor, and fleet-depot payback figures in this article were previously presented as complete paybacks and are now labeled unlevered simple paybacks before omitted costs (payment processing, charging losses, taxes and riders, fixed charges, downtime, replacement reserves, and cost of capital), the NEVI case previously treated grant reimbursement as an immediate capital offset without noting that reimbursement timing, compliance cost, and contingency risk are not modeled, and the no-grant case is now presented as the primary private-investment baseline.
Corrections (October 4, 2026): This article previously said the January 2026 Washington v. U.S. Department of Transportation ruling released NEVI funds; it barred withholding from the 20 states and D.C. that sued, and the article now also notes the February 2026 transfer of about $879 million in unobligated NEVI money. The fleet depot example priced gasoline at $3.15 a gallon; at the current EIA weekly price of $4.465, its payback is 2.4 years rather than 4.1. The article also named Con Edison's SmartCharge program and Xcel time-of-use options as demand-charge replacement rates; SmartCharge is an incentive program, and the rate examples are now California's EV rates and Con Edison's EV Phase-In Rate.